Skip to content

Database Health Monitor

What is Database Health Monitor?

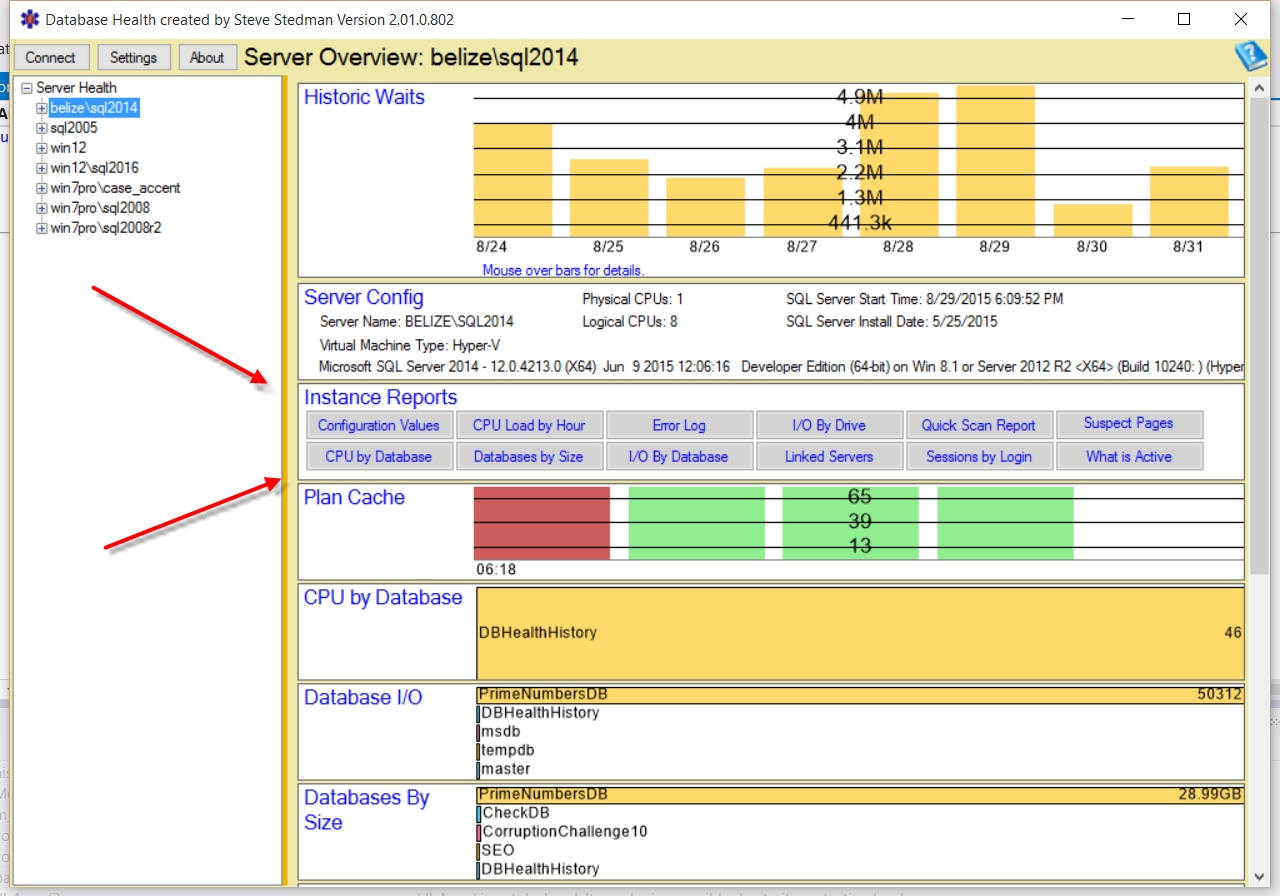
Database Health Monitor is an inexpensive yet powerful tool developed by Stedman Solutions to help SQL Server administrators monitor and maintain their database environments effectively. Designed with both usability and performance in mind, it offers a comprehensive suite of features to identify, diagnose, and resolve SQL Server issues before they escalate. This makes it an essential tool for DBAs and IT teams who prioritize database reliability and performance.

Core Features of Database Health

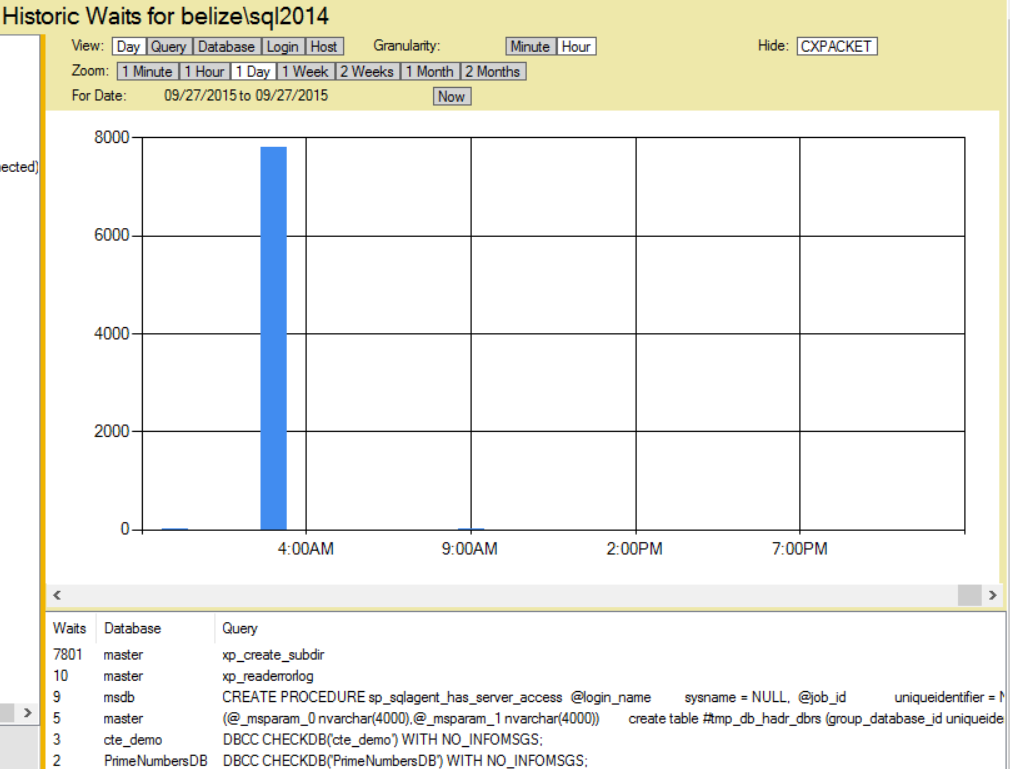
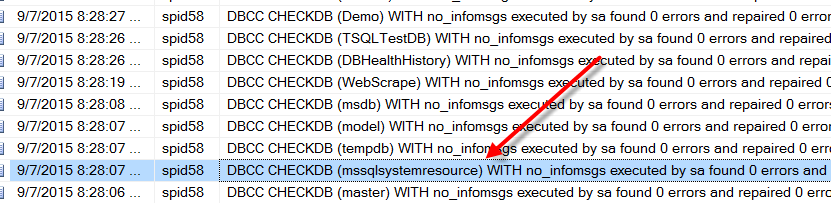
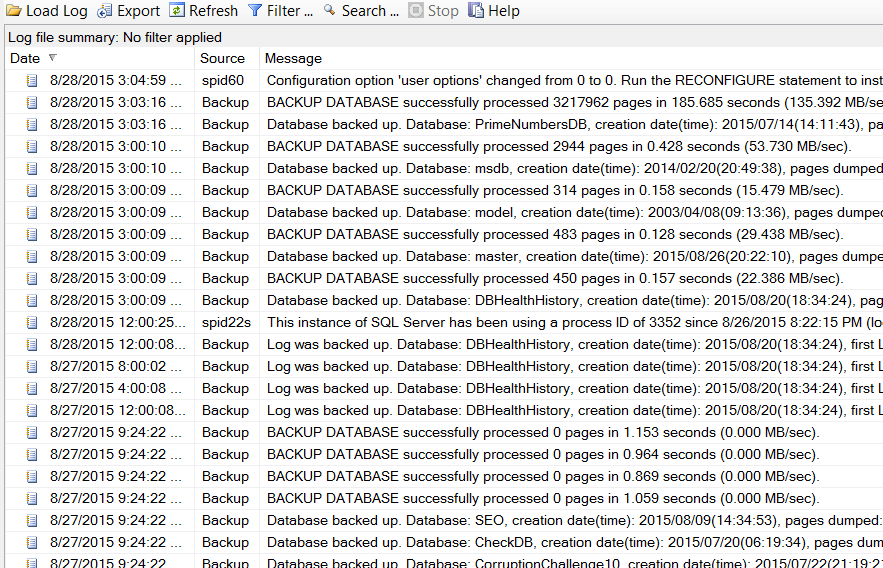
The tool provides a wealth of functionality, including real-time monitoring of critical SQL Server metrics such as wait statistics, index fragmentation, and resource utilization. Its intuitive dashboards allow administrators to gain a quick understanding of their server’s health, while detailed reports help track trends and identify areas needing optimization. With built-in tools for detecting common database issues like missing or unused indexes, blocking, and deadlocks, Database Health Monitor empowers users to make data-driven decisions to improve database performance.

Insights for Query and Index Optimization

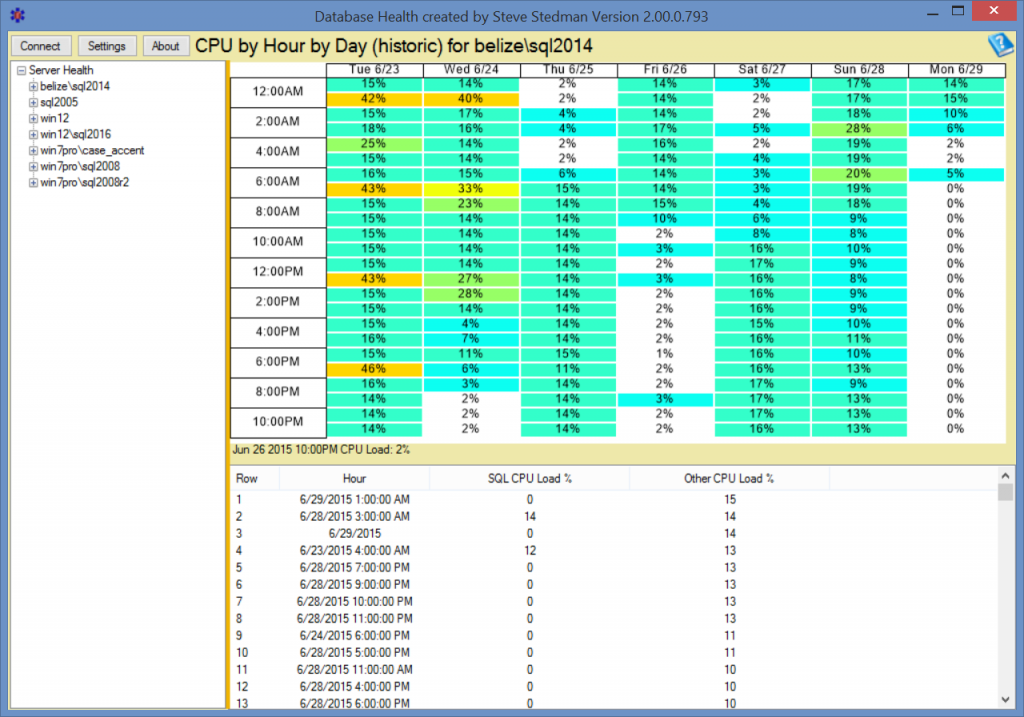
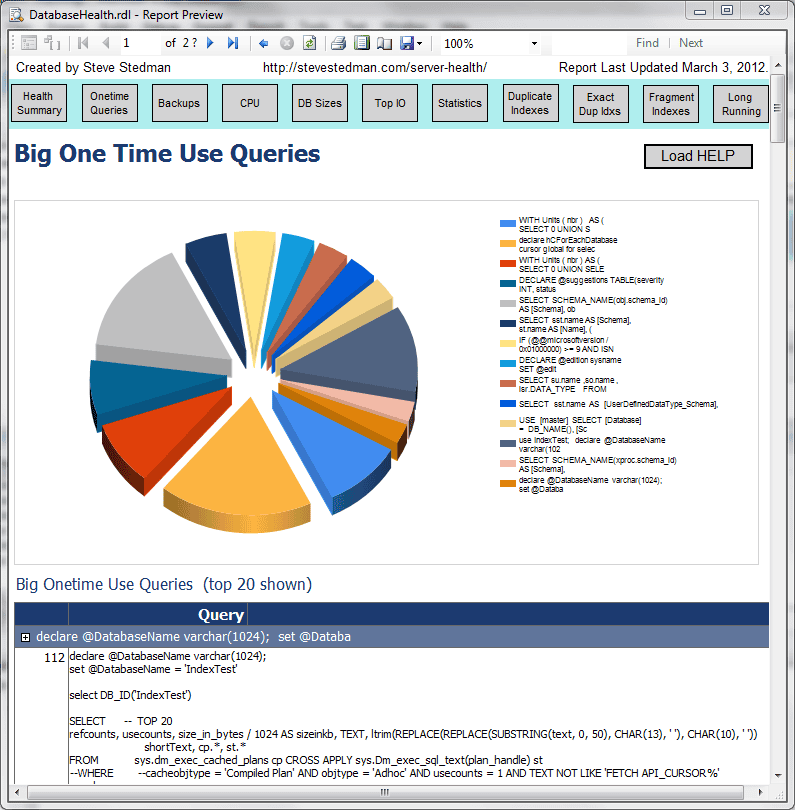
Database Health Monitor excels at identifying performance bottlenecks, including poorly performing queries and inefficient indexes. The tool provides insights into long-running queries, high CPU-consuming operations, and indexes that may be missing or causing performance drag due to fragmentation. By addressing these issues, organizations can significantly boost application performance, reduce resource consumption, and ensure their SQL Servers are operating at peak efficiency.

Proactive Problem Detection

One of the key benefits of Database Health Monitor is its ability to detect and report potential problems proactively. It identifies issues like high disk latency, excessive transaction log growth, and databases running out of space—helping DBAs address problems before they lead to downtime. The tool’s real-time monitoring capabilities make it an invaluable resource for maintaining uptime and ensuring business continuity.

Tailored for Practical Use Cases

From small businesses managing a single SQL Server instance to large enterprises with complex database ecosystems, Database Health Monitor caters to a wide range of needs. It supports capacity planning by analyzing trends in resource utilization and provides actionable recommendations to optimize your SQL Server environment. The tool is also widely used for troubleshooting, offering deep insights into performance problems and pinpointing their root causes.

Designed by SQL Server Experts

Database Health Monitor was built by the experienced team at Stedman Solutions, with insights from decades of managing SQL Server environments. This expertise is evident in the tool’s practical approach to problem-solving, offering features and guidance that address the challenges DBAs face daily. Whether you’re a seasoned database administrator or just starting out, Database Health Monitor provides the tools you need to succeed.

Cost-Effective Monitoring and More

Unlike many monitoring tools that come with steep licensing fees, Database Health Monitor offers robust features at an affordable price point. Its cost-effectiveness makes it accessible to organizations of all sizes, providing professional-grade monitoring without breaking the budget. This affordability ensures that even smaller businesses can take advantage of its powerful capabilities to maintain healthy, efficient databases.

The Perfect Companion to Managed Services

When paired with the Managed Services from Stedman Solutions, Database Health Monitor becomes even more valuable. The monitoring insights it provides align seamlessly with the proactive support and maintenance offered by our team. Whether you need assistance with query tuning, disaster recovery, or regular database health checks, Stedman Solutions ensures your SQL Server environment is running optimally. Learn more and get started at DatabaseHealth.com to elevate your SQL Server management to the next level.

PREEMPTIVE_OS_GETPROCADDRESS and xp_create_subdir

Here is a discovery that I made using the Database Health Monitor historic wait monitoring, on a server with slow storage where the backups were being written.

If you are seeing excessive waits on the PREEMPTIVE_OS_GETPROCADDRESS wait type and xp_create_subdir is the command with the wait, and this is occurring at the time your backups are being run, it is a symptom that the storage location for your backups is having I/O difficulties.

PREEMPTIVE_OS_GETPROCADDRESS and xp_create_subdir

I noticed this on a server with an external USB 2.0 attached hard drive that was being used for backups, and on a second server with a USB 3.0 external hard drive. When the backups run, there was a wait for the process to attempt to see if the backup directory exists, and to create it if it did not.

Read More »PREEMPTIVE_OS_GETPROCADDRESS and xp_create_subdir

mssqlsystemresource Database

I was looking through my SQL Server error logs to confirm that CheckDB was being run as I had scheduled based on my previous post to run DBCC CheckDB on all databases. I wanted to confirm that there was no corruption, and that all of the databases had been checked, and not had been missed. Going through this I noticed the logging of all of my databases, but one extra database showed up, the mssqlsystemresource database.

mssqlsystemresource database

Now the mssqlsystemresource database is an internal SQL Server database that is used by SQL Server, it also gets replaced by SQL Server when you do an upgrade of your SQL Server database. It is hidden so that people don’t have access to it, and it doesn’t show up when you run the undocumented sp_msforeachdb it doesn’t include the mssqlsystemresource database. Additionally the sys.databases view doesn’t include the mssqlsystemresource database.

Read More »mssqlsystemresource Database

DBCC CheckDB All Databases

If you use the SQL Server maintenance plans to run DBCC Check DB, you are not allowed to include TempDB in your DBCC CheckDB sequence. For a while I was using maintenance plans, and ending up adding a separate job step to run TSQL to just check TempDB.

Rather than using two different steps, the regular maintenance plan, and a special step for Temp DB, I have instead dumped the regular maintenance plan step, and just used the following TSQL code to run DBCC CheckDB against all databases on the SQL Server.

Option 1: DBCC CheckDB All Databases using sp_msforeachdb

I have included Option 2 below since there are some pretty serious flaws in the sp_msforeachdb script as shown in option 1, specifically sp_msforeachdb will occasionally skip databases. It also has trouble with databases created with certain characters.  Anyway if you want it, here is, but I would recommend paging down to Option 2 which is much more reliable. I would like to thank Patrick Flynn who showed me the flaws in sp_msforeachdb.

The stored procedure sp_msforeachdb takes a parameter of query that will get run against all databases on your SQL Server Instance.


EXEC sp_msforeachdb 'DBCC CHECKDB(''?'') WITH NO_INFOMSGS;';

You can set it up as a maintenance plan like this:

Read More »DBCC CheckDB All Databases

Database Health Monitor Version 2.1 coming soon

In the next week or two, I will be releasing version 2.1 of the Database Health Monitor application. I am just going through the final testing process now to get it ready for general release. There are a number of new features that have been requested since the release of version 2.0 that will be coming out in version 2.1. The most request feature was the addition of support for the F5 key to refresh reports. There have been several new server or instance level reports added, along with a new section to link to the instance level reports.

Database Health Monitor

Database Health Monitor Version 2.1 New Features

Here is a list of the newly requested features that are complete, and will be available in version 2.1 of the Database Health Monitor.

Read More »Database Health Monitor Version 2.1 coming soon

Silencing Backup Messages with Trace Flag 3226

ErrorLog_flooded

As a DBA you regularly schedule backups you might have regular full backups, incremental backups and hopefully regular backups. Over time you might realize that your error log is not longer filled with errors, but instead a majority of your error log is filled with backup messages. “Backup Database successfully … “,  “Database backed up…”, “Log was backed up”. This makes it a bit difficult to find the actual errors in this flood of backup messages. Your error log is no longer an error log, but it looks more like a backup log.

Trace Flag 3226

Trace flags in SQL Server are switches or parameters that can be used to turn on or off different features. If you use trace flag 3226 this will turn off all successful backup messages being written to the error log. There are a couple of ways to use trace flag 3226, one is to use DBCC TRACEON to turn on trace flag 3226 for the currently running instance. Using this option will turn it on until the next time the database instance is restarted.

Read More »Silencing Backup Messages with Trace Flag 3226

Understanding your Wait Statistics

SQL Server Performance Tuning Tips – Wait Statistics

Wait statistics are commonly overlooked ways to quickly find out what is causing your SQL Server to be slow. One of the reasons is it’s difficult to see how they are trending over time.

>>> It is not difficult with a monitoring tool. <<<

When someone reports a slow database yesterday at 2:00pm, do you know how to determine what’s causing it? You can check the logs, you can look at the history of running jobs, and you might even ask around to see if anyone was doing anything unusual at that time. If you are tracking wait statistics, it is quick and easy to zoom in on a point in time and see exactly what queries were slow and why they were slow.

You might be thinking the following:

  • Did someone run a slow ad-hoc query?
  • Was there something wrong with the network?
  • Did someone run an unscheduled SSIS ETL package?
  • Was an index being rebuilt?
  • Did someone change application code?
  • Was there a hardware failure of some kind?
  • Was DBCC CheckDB running?

What are Wait Statistics

Whenever SQL Server is waiting for something to happen it logs that information as a WAIT.

What type of things get logged:

  • If your SQL Server is waiting on I/O.
  • If it’s waiting on network traffic to another SQL Server.
  • If your database is waiting on a transaction to complete.

Most everything that SQL Server waits on gets logged. However this information doesn’t stay around for long.

Read More »Understanding your Wait Statistics

Database Health Monitor Version 2 Released

After 4 years of beta and 5500 installs of Database Health Monitor beta releases in the last 2 years, Database Health Monitor version 2 is finally complete. It is no longer in beta. If you are curious about the history of Database Health Monitor, take a look at my post from earlier in the week.

Here is a preview of one of the latest reports added in the Version 2.0 release of Database Health Monitor.

Database Health Monitor Version 2

Read More »Database Health Monitor Version 2 Released

Database Health Monitor Version 2 Almost Done

Over the last 4 years I have been working on the Database Health Monitor. I am about a week away from releasing Version 2, which will finally be out of the beta process. In preparation for the release I am sharing some of the history of this program.

In 2011 version 1 was released as a set of my favorite monitoring queries that had been formatted and made available through SSRS. As people started to try it out in late 2011 and early 2012, I quickly discovered that the process for distributing shared queries via SSRS reports wasn’t very easy for the people trying to use them. Many people quickly discovered the difficulty of installing these reports. The set of reports looked something like this.

OnetimeUseQueries


There were 10 reports that were linked from the top panel in the SSRS user interface. Although SSRS has some great features, it was challenging to switch database connections and monitor multiple servers.

In April of 2012 I gave up on the concept of using SSRS reports, and converted all the queries into a windows application and started enhancing the program. In September of 2012, I finally had the Beta 1 release of Database Health Reports out. It was a bit rough in the beginning, but from 2012 to 2015 through a series of almost 20 beta releases labeled names like Beta 1, Beta 8.2, Beta 10.1, and so forth I kept enhancing the program. Here is an early screenshot of somewhere around Beta 1 or Beta 2.

Read More »Database Health Monitor Version 2 Almost Done