Website Outage
Last night my website (this site) experienced an outage. Sometime during the night the Mysql process hosting my WordPress website crashed. Too bad there isn’t… Read More »Website Outage
Last night my website (this site) experienced an outage. Sometime during the night the Mysql process hosting my WordPress website crashed. Too bad there isn’t… Read More »Website Outage
Some of the biggest performance tuning wins that I have had over my career have been related to performance tuning queries that are being called from SSIS. So often the actual query performance gets overlooked in the SSIS environment. A few years ago I was able to tune a query that was being called from an SSIS package and reduce the runtime of that package from over an hour, to just 2 minutes. Its not always that big of a win, and there are other performance tuning options besides just tuning the queries, so lets take a look at some of them.
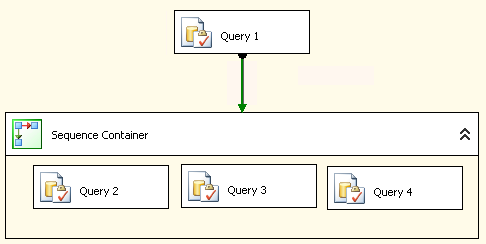 SQL Server Integration Services (SSIS) is one of those components that can help you out with your ETL (Extract, Transform and Load) work, or it can hinder your process if it is a poor performing ETL. There are many things that can easily cause an ETL to run for hours, when it should be running for minutes.
The following tips are intended as things to consider when performance tuning to improve your ETL Performance Using SSIS.
Statistics IO and Statistics Time is another SQL Server Performance Tuning Tip to help you better understand performance bottlenecks.
Have you ever wanted to know exactly how long it took for a query to run? Have you ever wondered how many I/O reads or writes were caused by your query? With Statistics IO and Statistics Time you can understand both of these.
This post is on using statistics IO to analyze query performance. There is another post on using Statistics Time for performance tuning.
I usually prefer to use Statistics IO over Statistics Time because the Statistics IO option gives better details on what exactly the query is doing.
Let’s take the following query as an example:
Statistics IO and Statistics Time are another SQL Server Performance Tuning Tip to help you better understand performance bottlenecks.
Have you ever wanted to know exactly how long it took for a query to run? Have you ever wondered how many I/O reads or writes were caused by your query? With Statistics IO and Statistics TIME you can understand both of these.
This post is on using statistics TIME to analyze query performance. There is another post on using Statistics IO for performance tuning.
Another SQL Server Performance Tuning Tip to help you better understand performance bottlenecks.
This is a simple step to get performance statistics on about any query you are writing in SSMS.
Let’s take the following query as an example:
Read More »Using Statistics Time for Performance Tuning in SSMS

Wait statistics are commonly overlooked ways to quickly find out what is causing your SQL Server to be slow. One of the reasons is it’s difficult to see how they are trending over time.
When someone reports a slow database yesterday at 2:00pm, do you know how to determine what’s causing it? You can check the logs, you can look at the history of running jobs, and you might even ask around to see if anyone was doing anything unusual at that time. If you are tracking wait statistics, it is quick and easy to zoom in on a point in time and see exactly what queries were slow and why they were slow.
Whenever SQL Server is waiting for something to happen it logs that information as a WAIT.
Most everything that SQL Server waits on gets logged. However this information doesn’t stay around for long.
Read More »Understanding your Wait StatisticsWhile watching a movie tonight, the Amazon Prime video system had an outage, no Amazon videos would play on my Amazon Fire TV Device. Netflix… Read More »System Outage… How do you communicate with your customers?
Being the middle of the summer in the northern hemisphere, and with the Database Corruption Challenge over, I thought I would cover something a bit lighter, and not as hard core as database corruption.
If you have been a DBA for more than a year or two you probably have some story about going on vacation, and getting the call from the office with some database problem. It might have been that someone forgot their password, or something more serious like a corrupt database. Either way, the simple or more complex issues are not why you went on vacation.
Here is a picture of a DBA on vacation in Hawaii. Notice the empty chair… They should be sitting in the sun sipping a tropical drink, but instead they are back in the hotel room with a VPN connection to the office dealing with some emergency (or perceived emergency) SQL Server issue instead of enjoying the beach.

DBA on Vacation (photo by Steve Stedman)
If you are looking for more info on the corrupt database with Week 10 of the Database Corruption Challenge, you can take a look at the week 10 Challenge Details.
With this being the final competition of the Database Corruption Challenge, I had to make it more difficult than the others, so I added 3 different types of corruption. This challenge was about the equivalent of any 3 of the other challenges.
I have split the solution to the Week 10 Challenge into 3 different posts, with each post explaining how to fix one of the three specific corrupt areas.
WARNING: DBCC WritePage is a dangerous command, that should never be used on any production database. It may invalidate your ability to get support from Microsoft on issues that arise with that database going forward. It is not my intention to encourage anyone to use DBCC WritePage ever. This is just what I used to create a corrupt database, and since creating corrupt databases is not part of the role of most DBAs, you should not use DBCC WritePage. Consider yourself warned.
Read More »Solution to Week 10 Part 1 Database Corruption Challenge
After 10 weeks (or almost weekly) of corrupt databases, missing data and a challenging competition the Database Corruption Challenge finally comes to an end. As part of the last week of the challenge I created a short blog interview for the participants. This interview is Patrick Flynn.
Patrick placed in third with a 3 way tie for third overall in the the Database Corruption Challenge scoring 21 points.
Here are the overall statistics for Patrick in the Database Corruption Challenge
Read More »Patrick Flynn Interview – Database Corruption Challenge
After 10 weeks (or almost weekly) of corrupt databases, missing data and a challenging competition the Database Corruption Challenge finally comes to an end. As part of the last week of the challenge I created a short blog interview for the participants. This interview is Neil Abrahams.
Neil placed in third place with a 3 way tie for third overall in the the Database Corruption Challenge scoring 21 points. He was one of only 3 participants to complete all 10 challenges in the contest, the other two were André Kamman and Rob Farley.
Here are the overall statistics for Neil in the Database Corruption Challenge
Read More »Neil Abrahams Interview – Database Corruption Challenge