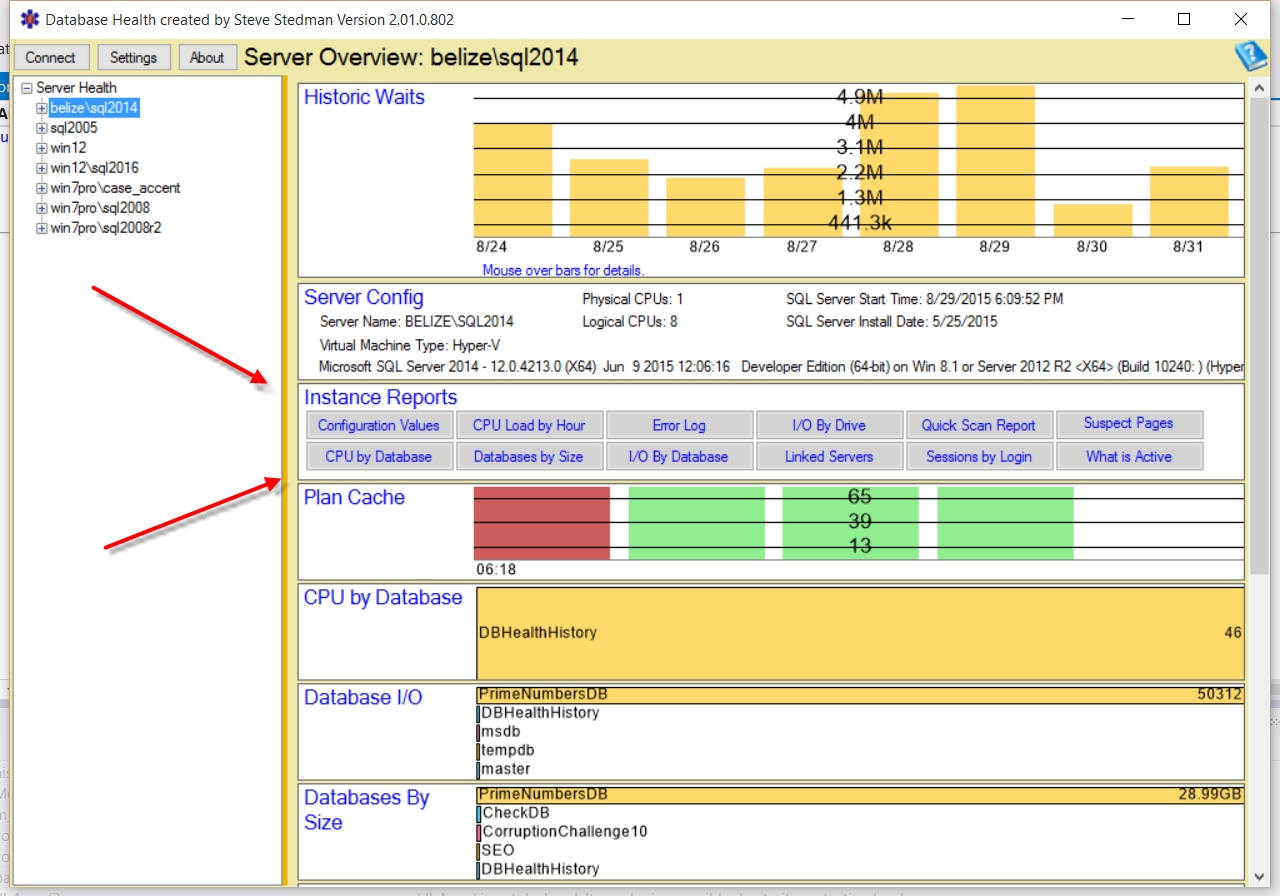
Database Health Monitor Quick Scan Report
With the updated release of Database Health Monitor yesterday, here is the updated list of documentation on the Quick Scan Report. All of the following… Read More »Database Health Monitor Quick Scan Report
With the updated release of Database Health Monitor yesterday, here is the updated list of documentation on the Quick Scan Report. All of the following… Read More »Database Health Monitor Quick Scan Report
The check for MAX DEGREE OF PARALLELISM has be added to the Database Health Monitor – Quick Scan Report. The max degree of parallelism setting… Read More »SQL Server MAX DEGREE OF PARALLELISM
With over 7500 downloads worldwide to date, I have just released the next installment of the FREE Database Health Monitor application.
Here what one person had to say about it “Excellent – It’s the first tool I open every morning to see what is going on in my production environment! Thanks for the great work!”
Download today:
Released March 20th, 2016.
It has been about 3 months since the last release, and I have added several new features, and many bug fixes.
Today I have the pleasure of releasing the next version of the Database Health Monitor application. Currently at version 2.2, I have been working on… Read More »Database Health Version 2.2 Released Today
The Quick Scan report in Database Health Monitor detects when you are performing SQL Server backups without compression, when the compression option is available. This applies to Full backups, Transaction log backups and Differential backups.
Not using compressed backups? Why not?
There are a couple minor drawbacks, the compressed backups take more CPU, not much more, but a tiny bit more. Also the compressed backups don’t compress very much when your database is using Transparent Data Encryption (TDE).
As part of the Database Health Monitor version 2.1 release there were many new report includes, one of those was the backup status report. A… Read More »Featured Report: Backup Status Report
I have just released version 2.1 of Database Health Monitor, this release involved 2 months of development since version 2.0 was released in July. People… Read More »Database Health Monitor version 2.1 Just Released
In the next week or two, I will be releasing version 2.1 of the Database Health Monitor application. I am just going through the final testing process now to get it ready for general release. There are a number of new features that have been requested since the release of version 2.0 that will be coming out in version 2.1. The most request feature was the addition of support for the F5 key to refresh reports. There have been several new server or instance level reports added, along with a new section to link to the instance level reports.
Here is a list of the newly requested features that are complete, and will be available in version 2.1 of the Database Health Monitor.
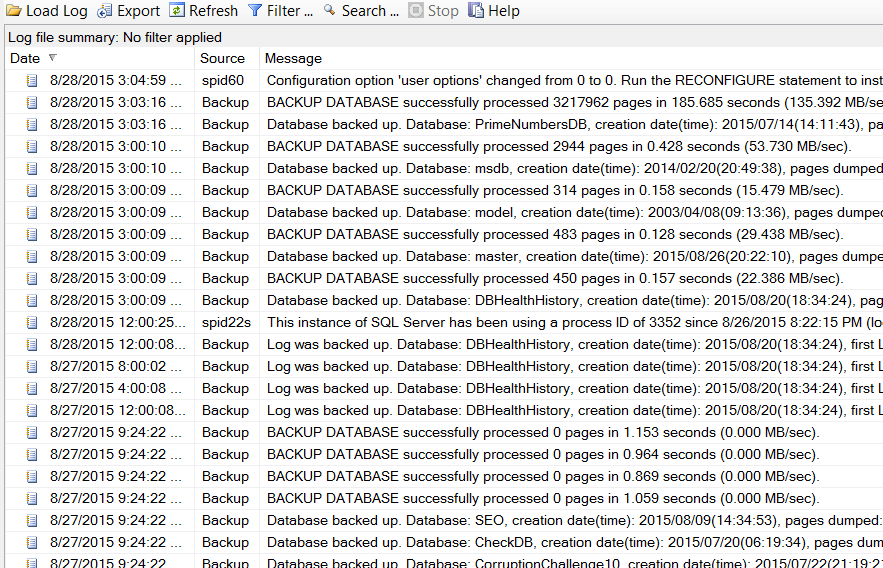
As a DBA you regularly schedule backups you might have regular full backups, incremental backups and hopefully regular backups. Over time you might realize that your error log is not longer filled with errors, but instead a majority of your error log is filled with backup messages. “Backup Database successfully … “, “Database backed up…”, “Log was backed up”. This makes it a bit difficult to find the actual errors in this flood of backup messages. Your error log is no longer an error log, but it looks more like a backup log.
Trace flags in SQL Server are switches or parameters that can be used to turn on or off different features. If you use trace flag 3226 this will turn off all successful backup messages being written to the error log. There are a couple of ways to use trace flag 3226, one is to use DBCC TRACEON to turn on trace flag 3226 for the currently running instance. Using this option will turn it on until the next time the database instance is restarted.
Read More »Silencing Backup Messages with Trace Flag 3226
Wait statistics are commonly overlooked ways to quickly find out what is causing your SQL Server to be slow. One of the reasons is it’s difficult to see how they are trending over time.
When someone reports a slow database yesterday at 2:00pm, do you know how to determine what’s causing it? You can check the logs, you can look at the history of running jobs, and you might even ask around to see if anyone was doing anything unusual at that time. If you are tracking wait statistics, it is quick and easy to zoom in on a point in time and see exactly what queries were slow and why they were slow.
Whenever SQL Server is waiting for something to happen it logs that information as a WAIT.
Most everything that SQL Server waits on gets logged. However this information doesn’t stay around for long.
Read More »Understanding your Wait Statistics